Alternative Personal Carbon Footprint Tracker
Comparing collaborative and competitive interaction design to reduce the gap between environmental intentions and real-world actions
Role
Timeline
Tools
UX Designer & Developer
1 Semester Individual University Project
Figma, Visual Studio Code, Firebase
The Challenge
Many people want to live more sustainably but struggle to translate good intentions into meaningful action. Carbon emissions are often communicated through abstract numbers and technical metrics, making it difficult for users to understand which everyday behaviors have the greatest environmental impact.
The challenge was to design an experience that transformed invisible carbon data into intuitive, emotionally meaningful feedback. Rather than displaying kilograms of CO₂, the goal was to explore whether visual metaphors and social interaction could motivate long-term behavioral change.
Project Overview
This project explored how interface design can encourage sustainable behavior by making environmental impact easier to understand. Instead of presenting users with abstract CO₂ statistics, I designed and evaluated two mobile concepts that translated carbon data into engaging visual experiences. Through user research, prototyping, and real-world testing, I investigated how different motivational strategies influenced users' daily decisions.
Research
Literature Review
Before designing the solution, I conducted an extensive literature review on persuasive technology, eco-feedback systems, and behavioral psychology. This research identified concepts such as Unit Blindness, Carbon Ignorance, and the Value-Action Gap, which became the foundation for the design process.
Survey
An initial survey explored how participants understood carbon emissions and sustainability. The findings revealed that many users preferred intuitive visual feedback over precise numerical data and struggled to estimate the environmental impact of everyday activities.
User Interviews
Following the prototype development, I conducted semi-structured interviews to understand participants' emotional responses, motivations, and behavioral changes while using both applications in their daily lives.
User Study
Participants used both applications over two weeks in their own homes, allowing the research to capture authentic everyday interactions rather than controlled laboratory behavior. Each participant experienced both concepts before comparing their experiences.
Timeline
Research
1
Gather qualitative and quantitative data to understand user behaviors, needs, and market context.
Problem Definition
2
Synthesize research findings into a clear, focused problem statement that defines the exact challenge to solve.
3
Ideation
Brainstorm a wide range of creative concepts and potential solutions without immediate constraint.
Low-Fidelity Wireframes
Sketch basic structural layouts to rapidly explore user flows and content placement without visual detail.
High-Fidelity Design
Develop polished, pixel-perfect visual interfaces complete with final typography, colors, and interactive components.
6
Developing
Translate the final designs into functional, production-ready software code across target platforms.
7
2 week User Testing
Two groups of 5, each used one app for a week, then swapped, everyone experienced both. Followed by two rounds of semi-structured interviews.
8
Interview analysis
Examine user feedback and testing transcripts to identify patterns, validate assumptions, and prioritize final refinements.
Survey - Phase 1
Before designing anything, I needed to confirm that the problem I suspected, that raw carbon numbers don't actually help people change behavior, was real. I ran a survey with 26 adults aged 18–34, comparing how people responded to technical data versus metaphorical visualizations, and testing how well they could reason about environmental impact in the first place.
The results were striking. 65% of participants chose a visually simple "Health Bar" widget over a 100%-accurate numerical chart for their home screen, even after being told the Health Bar was only 80% accurate. Of those who kept the numerical chart, a third admitted the numbers "just felt like a stat" rather than something that motivated change. When asked to rank the emissions of different transport methods, 42% got it wrong, and when estimating the CO2 of a transatlantic flight, only 38% chose the correct answer, most wildly underestimated it. Meanwhile, 77% said they'd feel more motivated if their footprint were ranked against their neighbors rather than kept private.
Together, these findings gave me the evidence I needed:
People aren't unmotivated, they're carbon-illiterate, and social comparison is a stronger lever than raw information. This became the foundation for the two app concepts I built next.
Study Design (Phase 2)
Rather than committing to a single solution, I explored two distinct interaction models to understand how different forms of motivation influence sustainable behavior. Each concept translated environmental data into intuitive visual metaphors while encouraging users to reflect on their daily habits through a different psychological approach.
Concept One: The Shared Garden
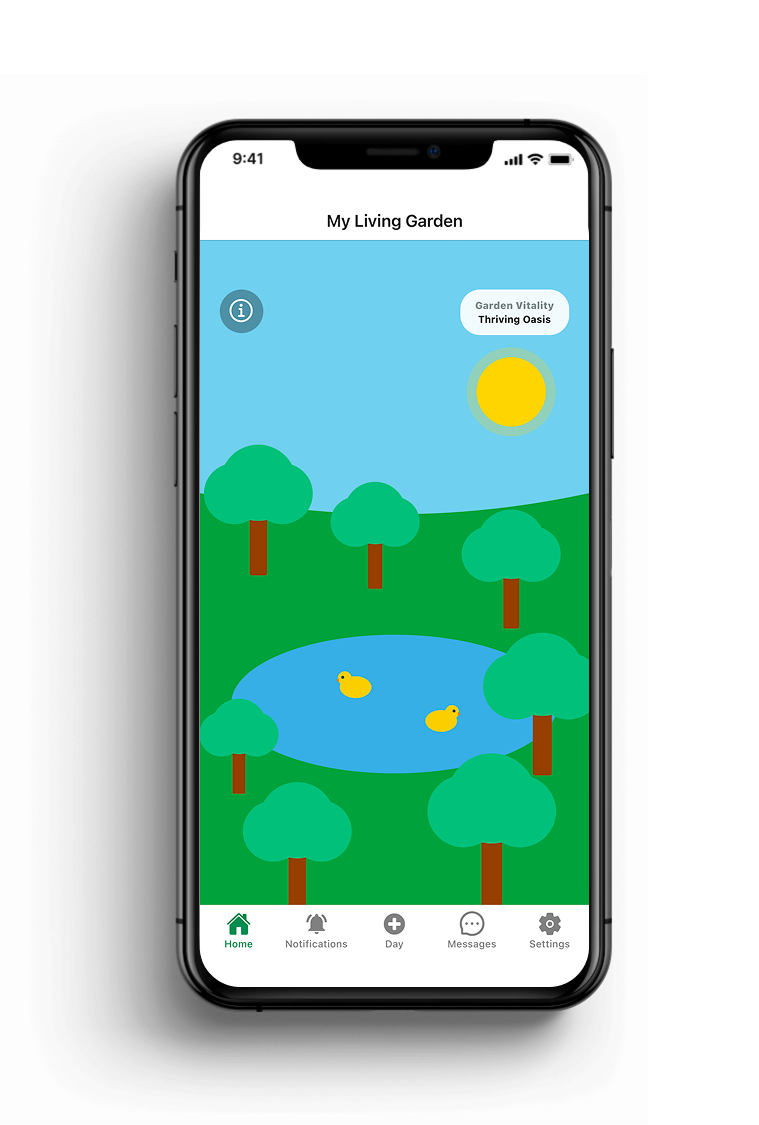
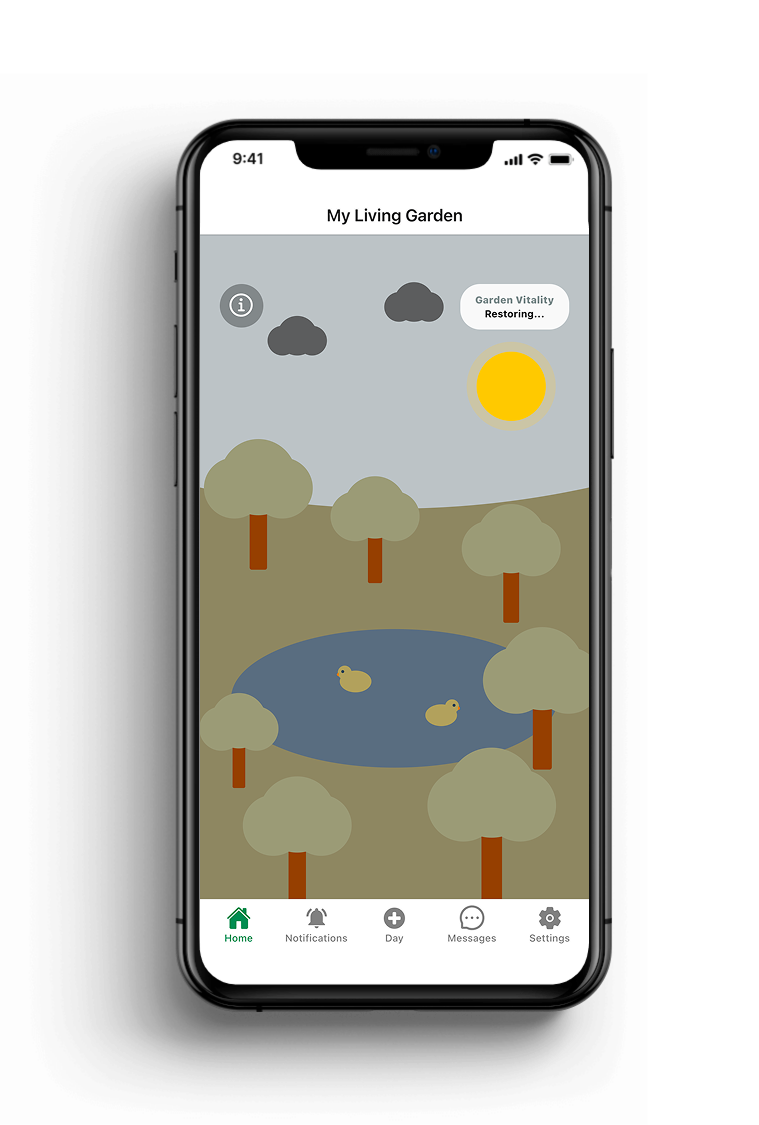
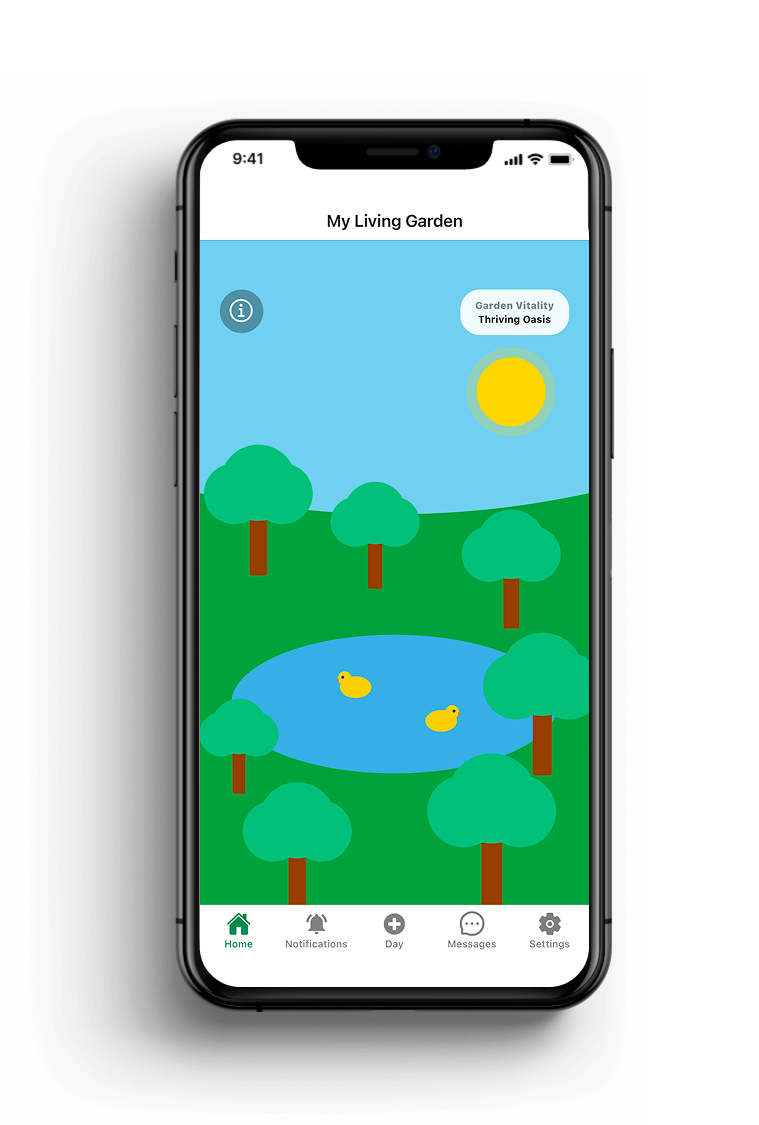
The Shared Garden visualized the collective environmental impact of a group through the health of a shared ecosystem. As users logged sustainable or high-impact behaviors, the garden evolved in real time, encouraging collaboration, accountability, and a shared sense of responsibility rather than individual competition.
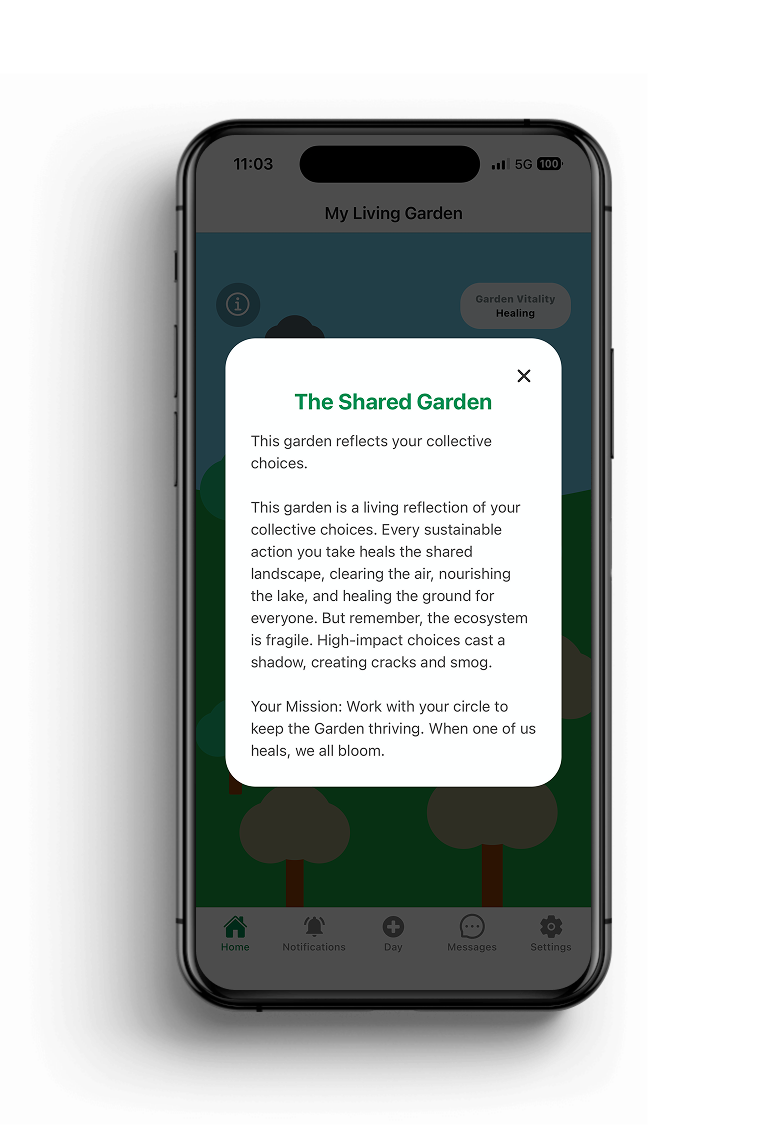
Info Button
Concept Two: The Nature Trail
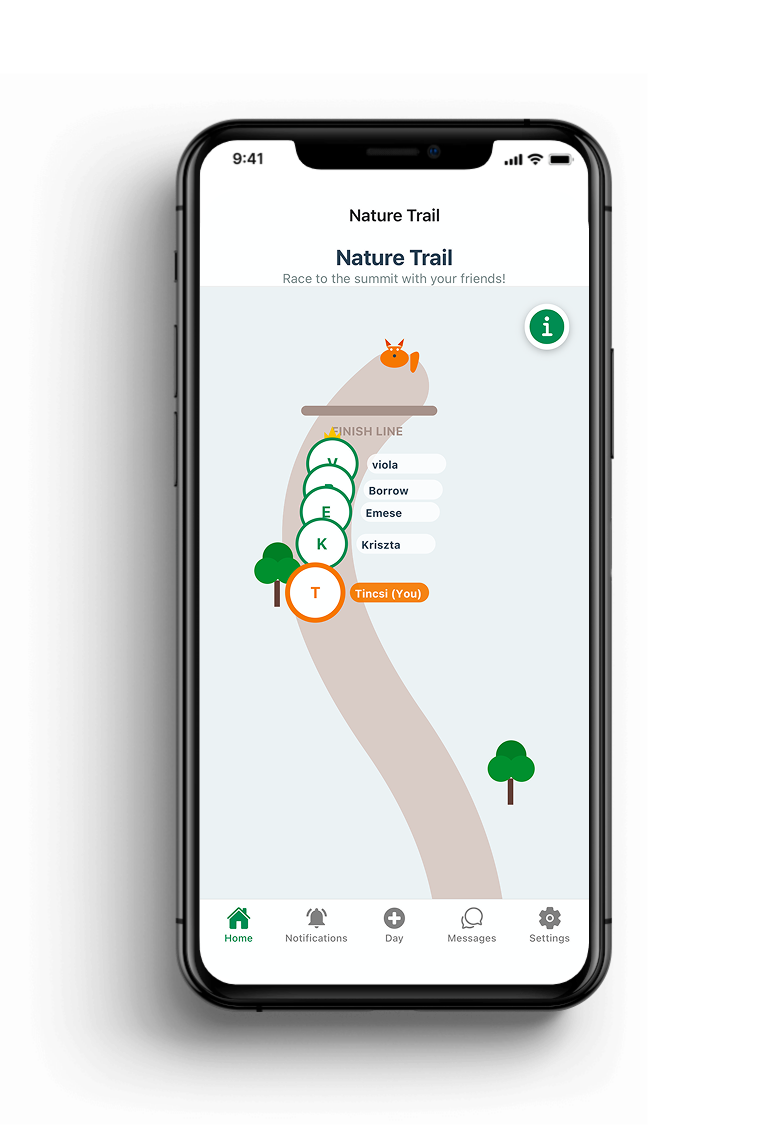
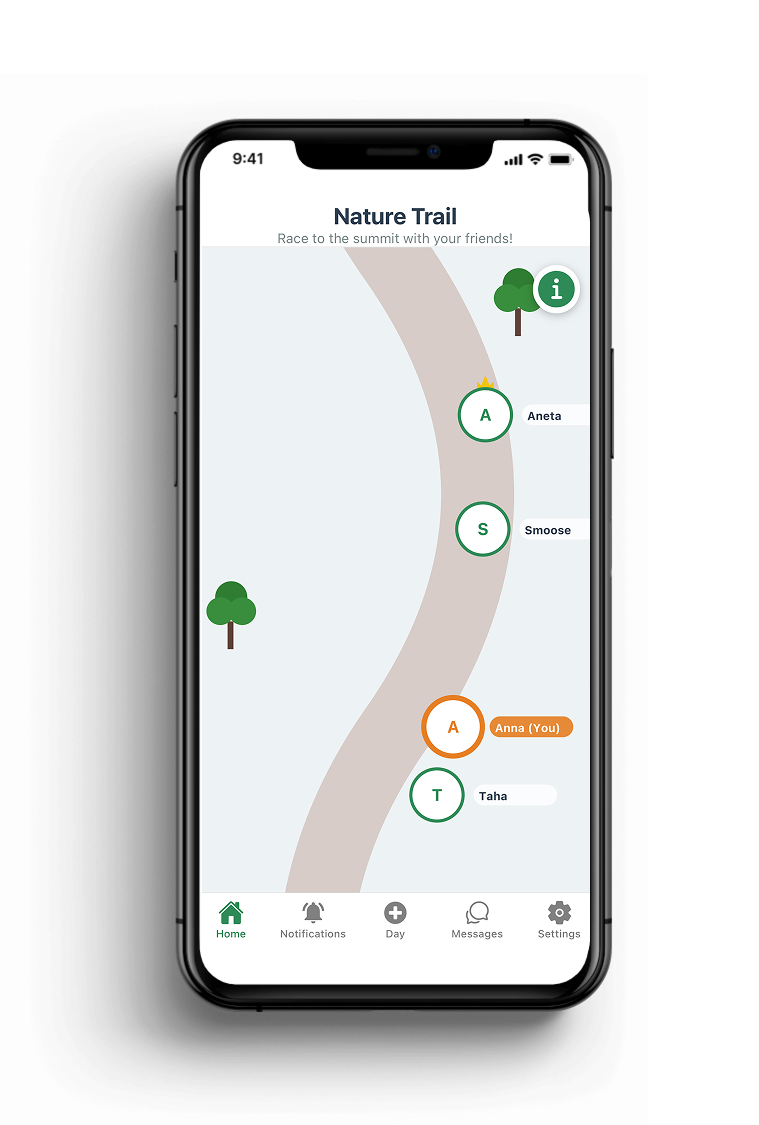
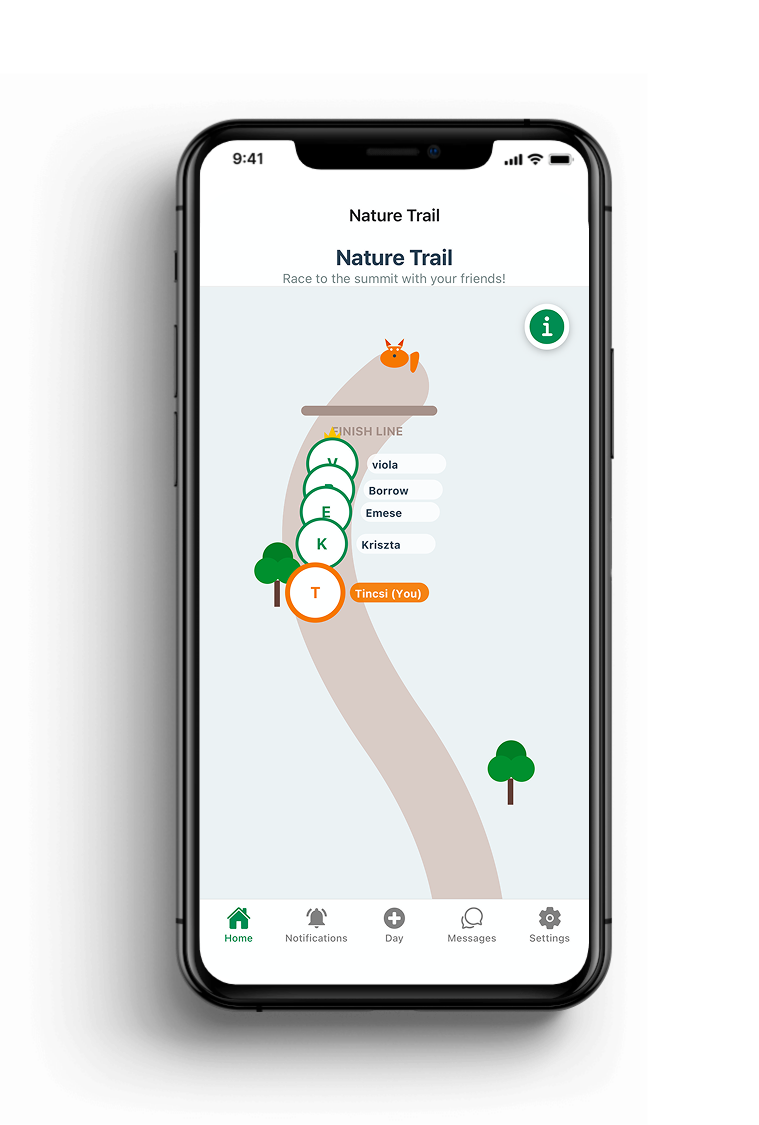
The Nature Trail transformed sustainable actions into physical progress along a shared path. Users could compare their progress with friends, creating a friendly competitive experience that motivated everyday environmental decisions through visible achievement and social comparison.
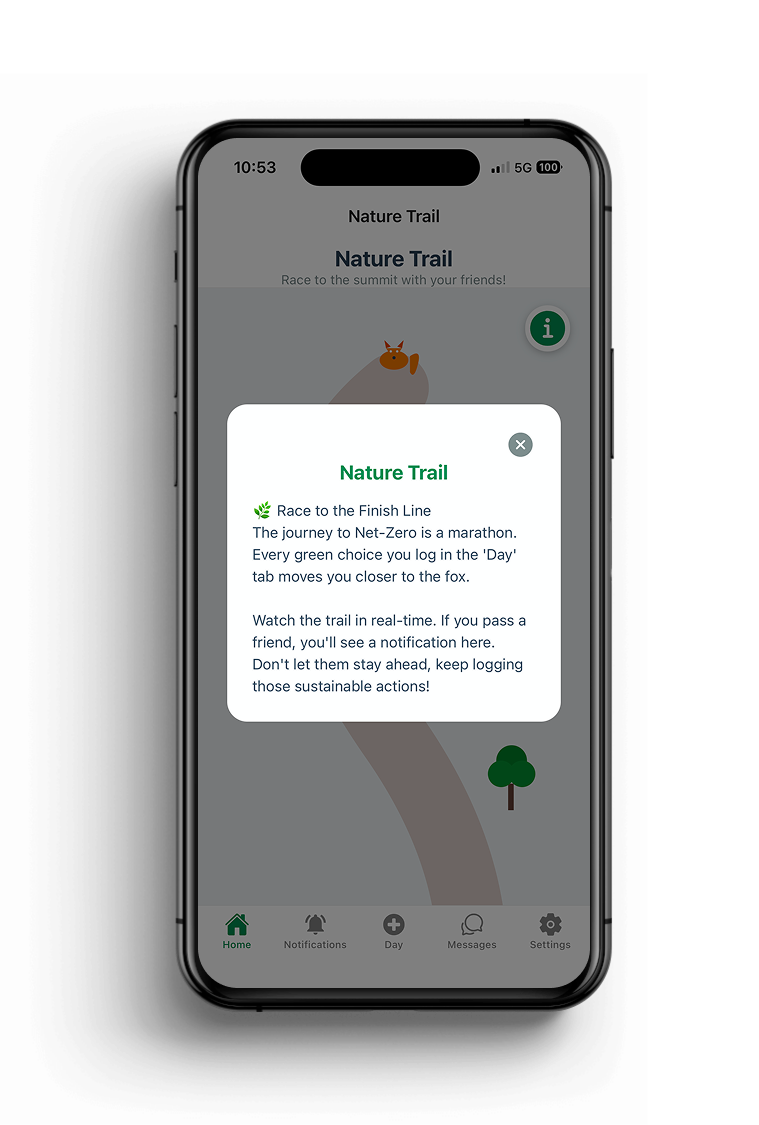
Info Button
Shared Features
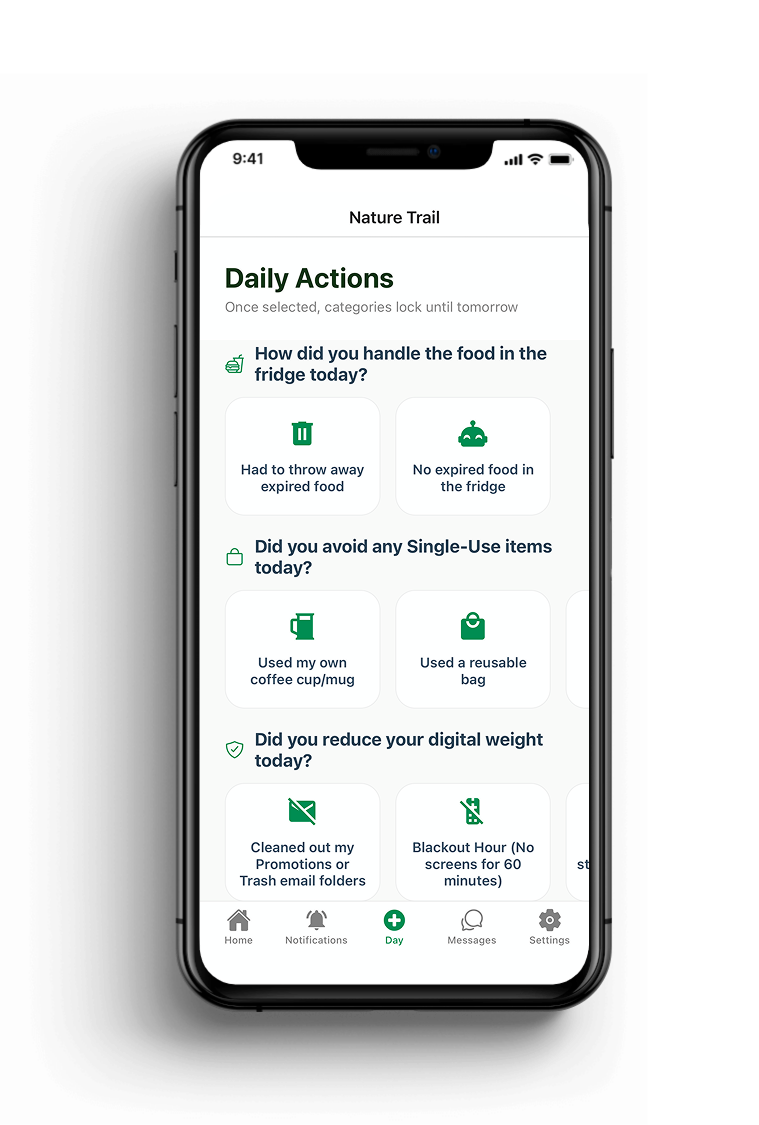
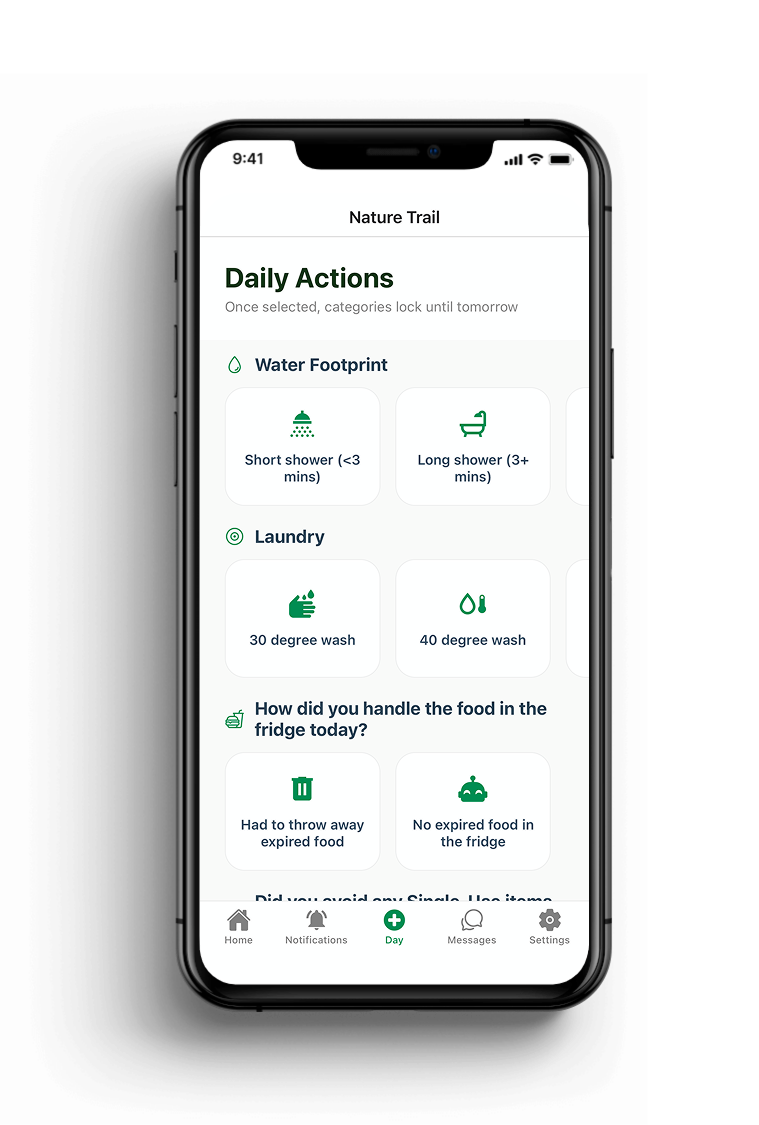
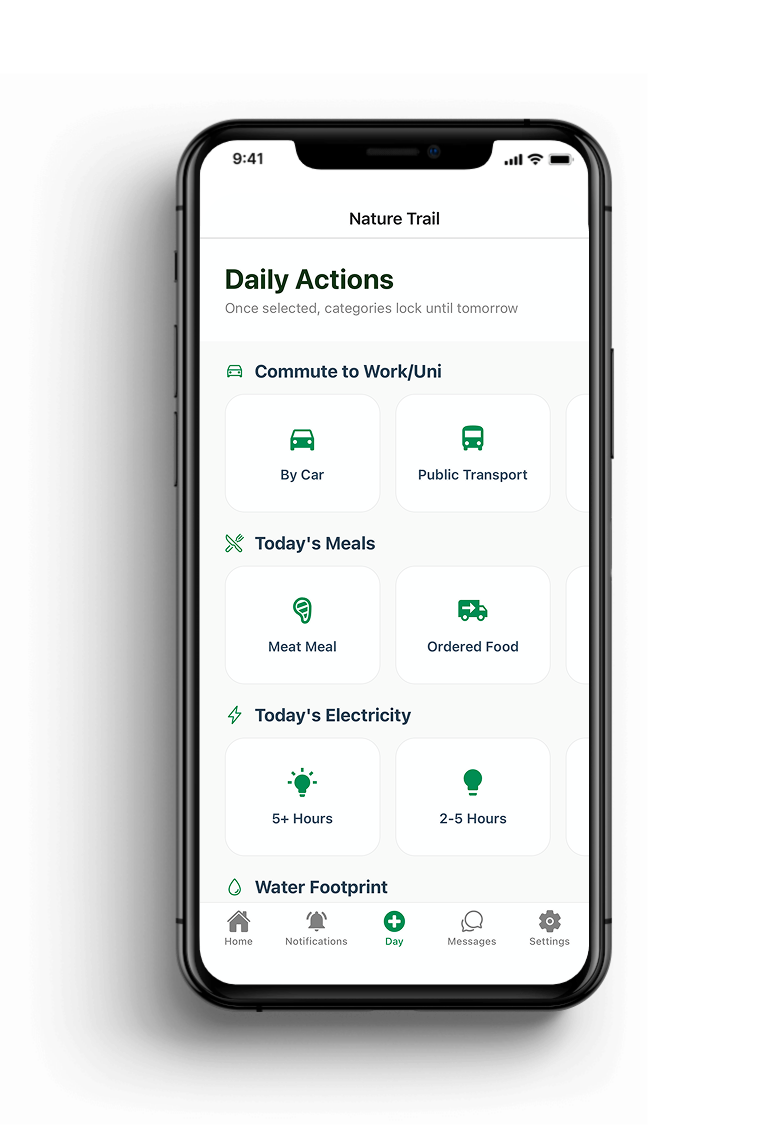
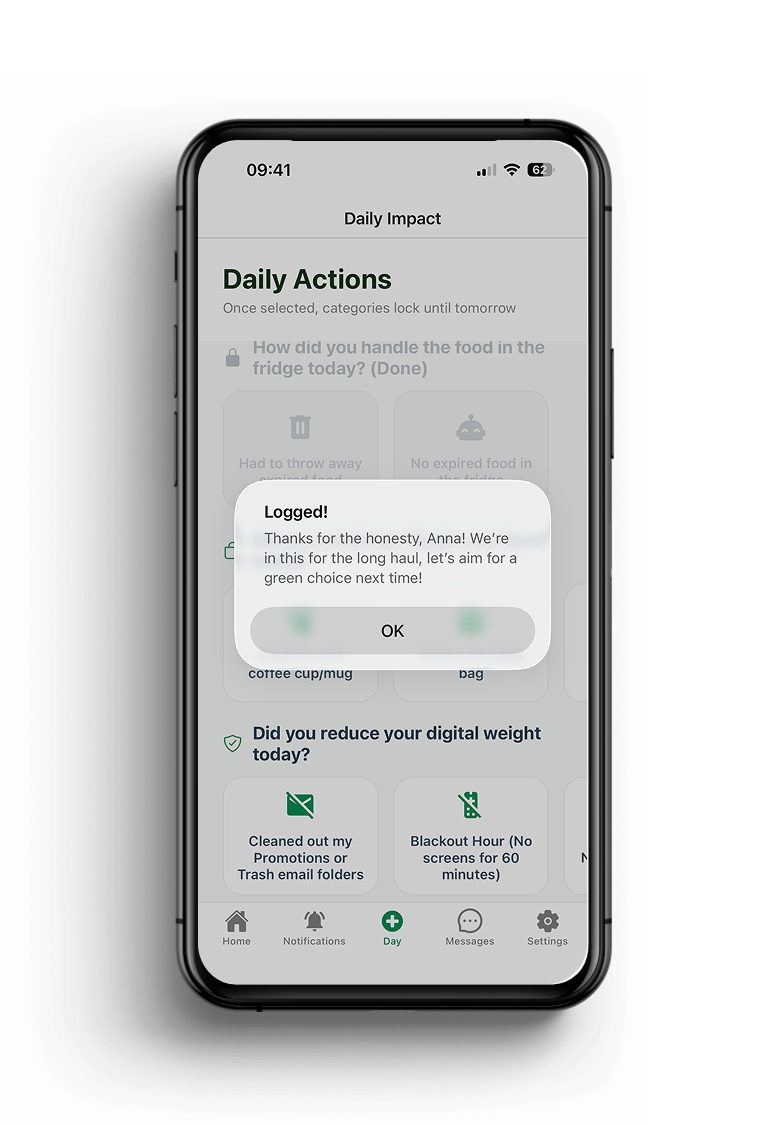
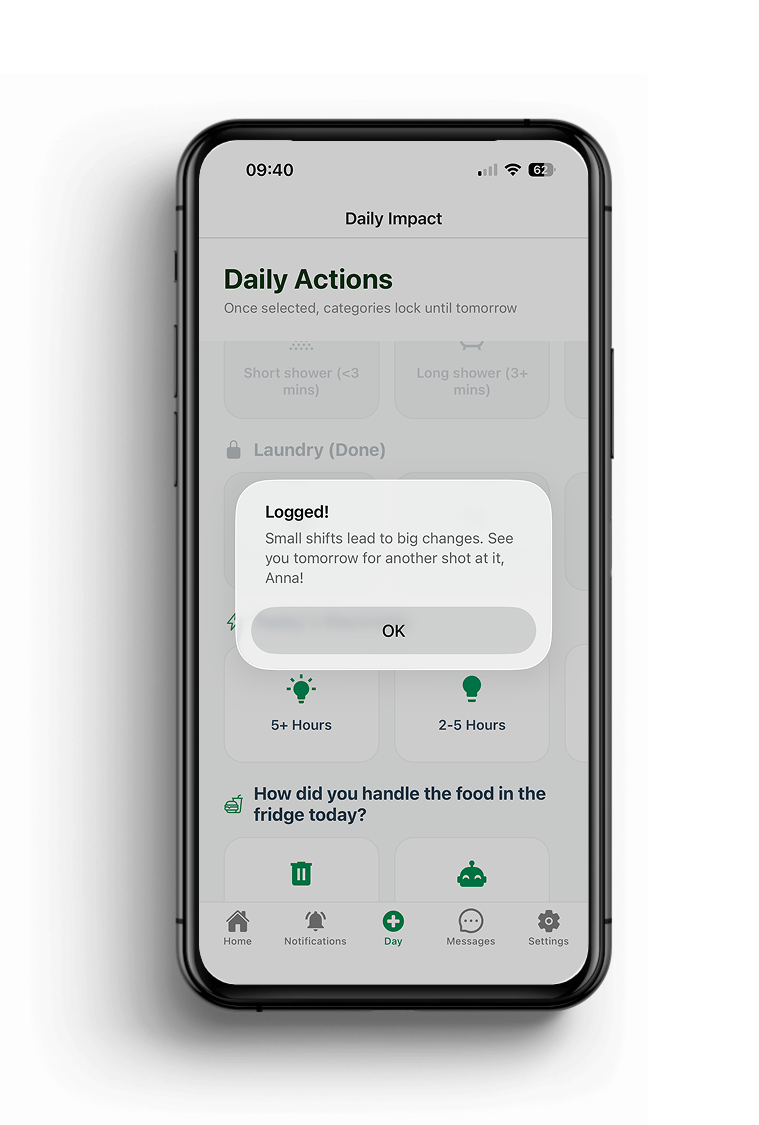
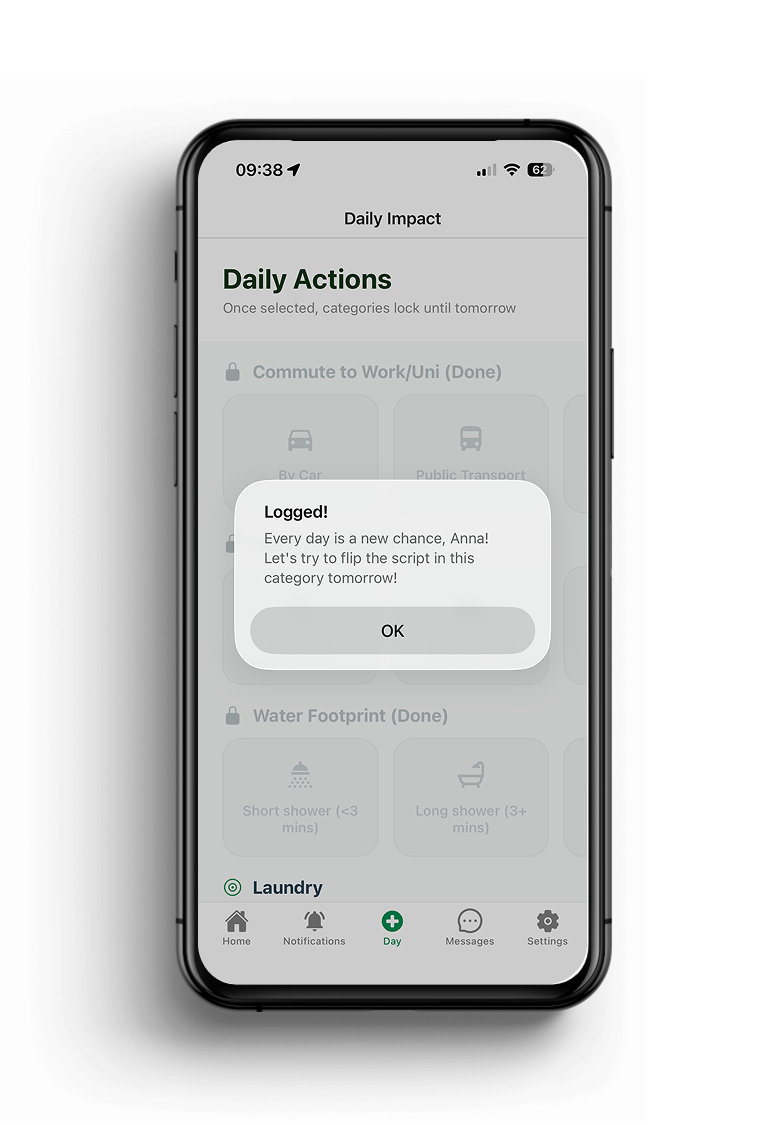
Daily Reflection
Users recorded everyday activities through a simple guided questionnaire that focused on common lifestyle choices rather than complex carbon calculations. This reduced friction while helping users reflect on the environmental impact of their daily routines.
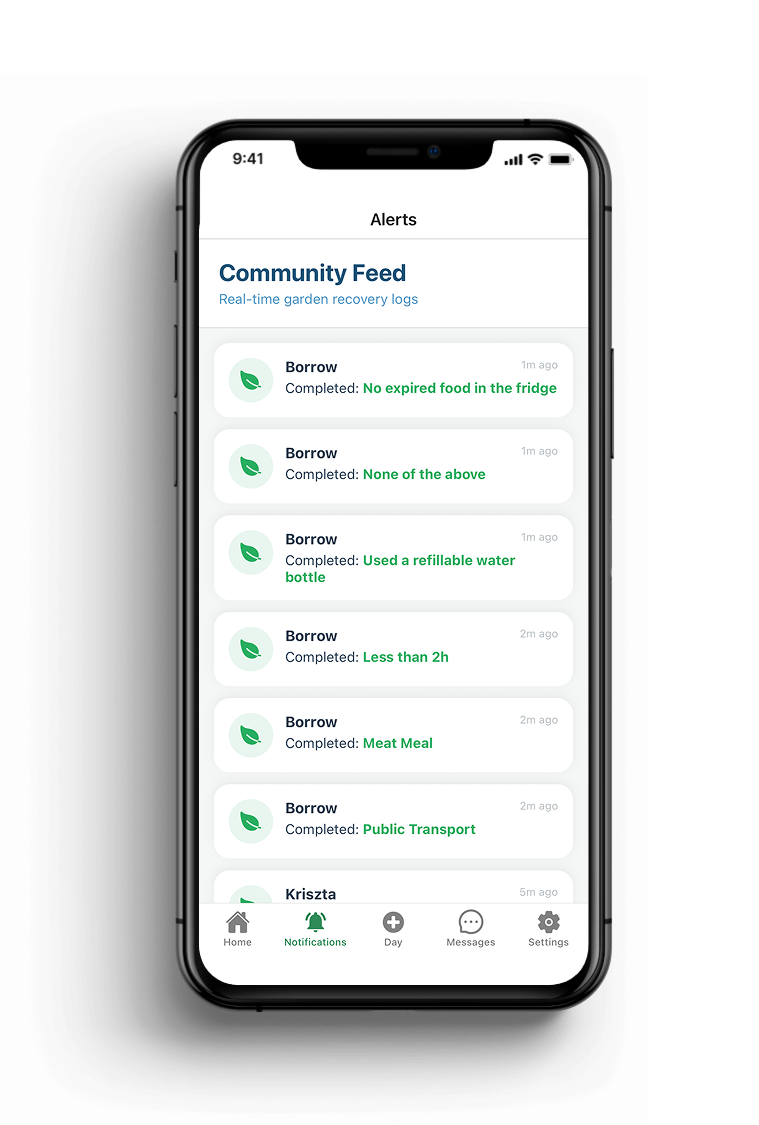
Social Activity Feed
Real-time notifications highlighted actions completed by other participants, creating transparency, encouraging discussion, and reinforcing positive environmental behaviors through social awareness.
Group Messaging
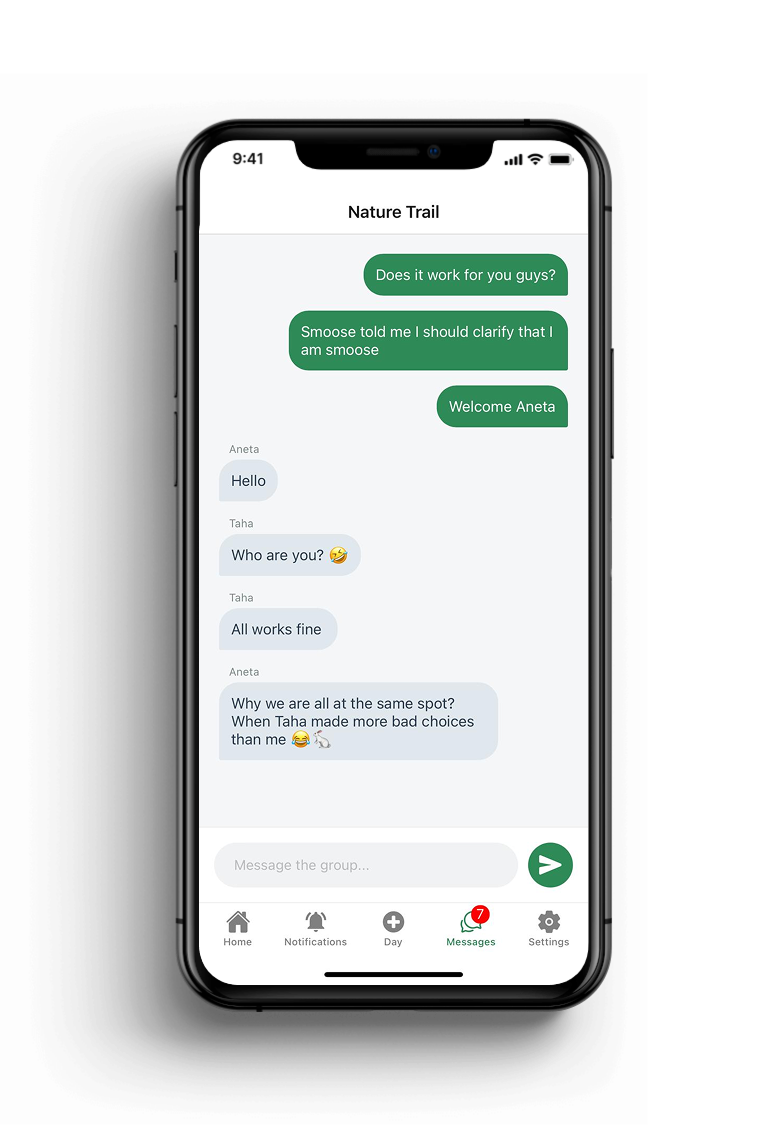
Integrated messaging encouraged participants to discuss progress, celebrate achievements, and motivate one another, turning sustainability into a shared social experience rather than an individual task.
Testing
I recruited two small groups of friends and family who reported strong environmental values but inconsistent action, the exact "Value-Action Gap" I was investigating. Each group used one app for a week, then swapped to the other for the second week, so every participant could directly compare a competitive and a collaborative model. Each day, participants logged simple daily choices (commute, meals, laundry, etc.) through the app, and I conducted semi-structured interviews after each week, the first to capture immediate reactions, the second to compare both experiences directly.
Findings
By the end of the study, something notable had happened: participants had almost entirely stopped thinking in kilograms of CO2. They spoke instead about "healing the garden" or "gaining meters on the trail", proof that the metaphors had genuinely replaced abstract numbers as their mental model for environmental impact.
The two apps produced very different emotional experiences. The Nature Trail's competitive structure was the stronger short-term motivator, seeing a friend pull ahead pushed people to take extra action, including small ones they'd previously ignored, like clearing out old emails to gain ground. But it also introduced friction: some participants grew suspicious that others were logging inaccurately just to win.
The Shared Garden, by contrast, created a calmer, more forgiving space. Because outcomes were collective, participants felt safe admitting "bad" days, one exchange saw a participant joke about skipping a shower, met with "anything for our green garden" from a groupmate, rather than judgment. But that same collectivism sometimes backfired: when the group's shared effort wasn't enough to keep the garden healthy, individuals felt their personal effort didn't matter.
Interestingly, participants who started with one app and moved to the other reacted in opposite ways: those who went from competition to collaboration felt frustrated by the loss of individual visibility, while those who went from collaboration to competition became more suspicious and confrontational. By the end, almost everyone independently arrived at the same request: a hybrid system that let them race individually while still contributing to something shared.
Limitations
This study was intentionally small in scope, and I want to be upfront about that. The sample was limited to ten tech-literate participants aged 18–34, based in Europe, tested over a two-week period, enough to observe real behavioral and emotional patterns, but not to say whether they hold for other age groups, cultures, or longer timeframes. I also made a deliberate design trade-off: simplifying real carbon complexity into approachable metaphors made the apps easier to understand, but it necessarily sacrifices some scientific precision, a tension that's worth acknowledging rather than glossing over.
Future Work
A few directions feel like natural next steps. First, a longer, multi-month study would show whether the motivation these metaphors create actually survives past the novelty phase. Second, given how clearly participants wanted "both," I'd want to prototype a genuine hybrid model that combines individual competitive progress with a shared collective goal, rather than treating them as separate systems. Finally, I'd like to test this across different cultural contexts, competition, collaboration, and social visibility likely carry different weight depending on someone's background, and understanding that would make a system like this far more broadly effective.